Graphs and statistics in ProfVet Pets
|
| The demand for graphs and statistics has become
overwhelming, so this has now been implemented into ProfVet Pets. Below is a
preview of some of the graphs and statistics that will be added: |
 |
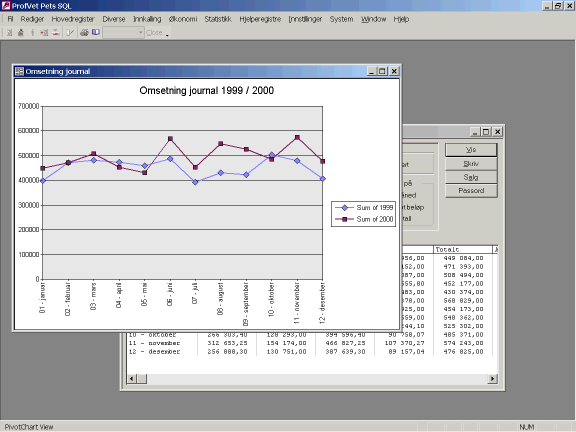
| Above: Line-diagram of the total trade, based on
numbers from the journal, ordered by month. |
 |
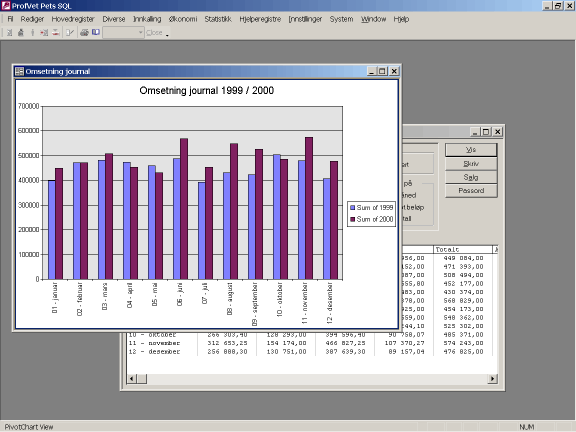
| Above: Column-diagram of the total trade, based
on numbers from the journal, ordered by month. |
 |
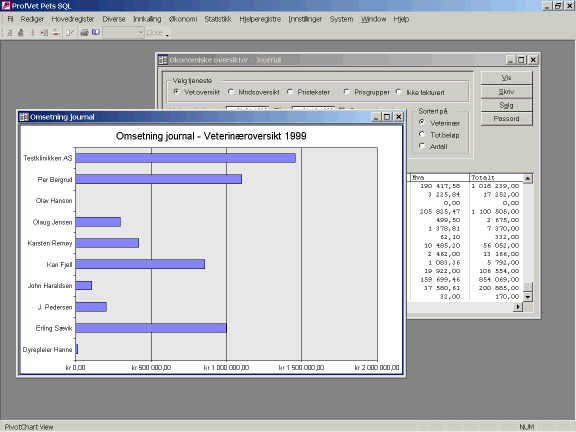
| Above: Column-diagram of the total trade, based
on numbers from the journal, ordered by veterinarian. |
 |
| Above: Column-diagram of the total attendance,
based on numbers from the summons, ordered by type of summon. |
| Most likely, more types and variations of graphs
and statistics will be added later on. Possibly some that the user can
generate based on own criteria's. |


